CrystalMark Retro Benchmark Results – ASUS ROG Strix G713QR
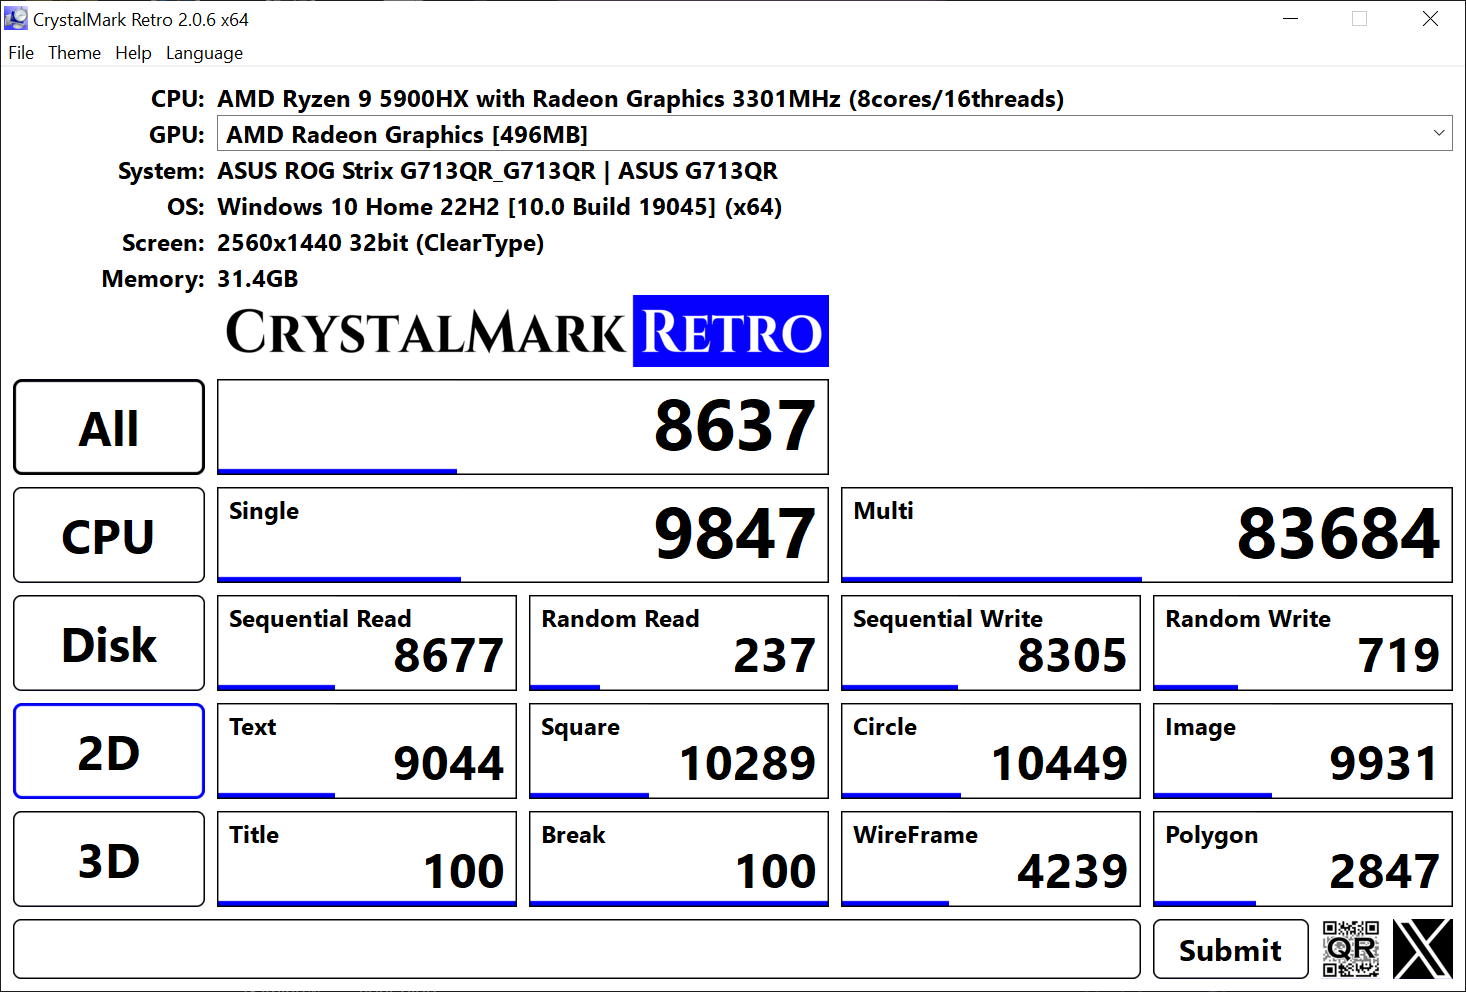
CrystalMark Retro is a modernized version of the classic CrystalMark benchmarking suite, designed to test CPU, GPU, disk, and overall system performance in a straightforward, easy-to-read interface. In this run, we tested the ASUS ROG Strix G713QR equipped with an AMD Ryzen 9 5900HX processor and integrated Radeon graphics.
System Specifications
Overall Score
- All (Total Score): 8,637
This number represents the combined performance index from all tested categories, giving a general idea of the system’s balance between CPU, disk, and graphics capabilities.
CPU Performance
The Ryzen 9 5900HX delivers strong multi-threaded performance thanks to its 8-core/16-thread Zen 3 architecture, while still maintaining respectable single-core speeds for tasks that don’t scale across many threads.
Disk Performance
Sequential speeds are healthy, suggesting a solid NVMe SSD, but random read/write scores are lower than expected for high-end drives, possibly indicating a system drive that’s more tuned for sustained throughput than quick small file access.
2D Graphics Performance
The integrated Radeon Graphics core handles basic 2D rendering efficiently, making it more than capable for desktop productivity and lightweight creative tasks.
3D Graphics Performance
3D performance is minimal here since the test was run on integrated graphics rather than the system’s dedicated GPU (likely disabled for this benchmark). Dedicated GPU testing would yield significantly higher 3D scores.
Conclusion
While the integrated GPU shows modest 3D capability, the CPU and disk performance stand out as strong, particularly in multi-core workloads. This benchmark confirms the Ryzen 9 5900HX is a powerhouse for productivity, and with a dedicated GPU active, the ASUS ROG Strix G713QR would easily handle gaming and demanding creative workflows.
For more details on the integrated GPU tested here, visit:
Radeon Vega 8 GPU Specifications
Benchmark powered by Download - Crystal Dew World en